110
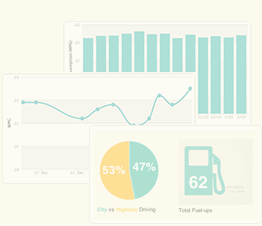
2011 Land Rover Defender. Property of DanWarden. Added Jul 25 2011
2011
|
Total Fuel-ups
88
|
Avg Miles/Fuel-Up
225.1
|
Avg Price/Gallons
£5.29
|
|
Total Miles Tracked
18,682
|
Total Gallons Fueled
777.22
|
Avg Price/Fuel-up
£49.47
|
|
Total Spent
£4,353.69
|
Avg Price/Mile
£0.22
|
Avg MPG
24.0
|
2012
|
Total Fuel-ups
55
|
Avg Miles/Fuel-Up
108.9
|
Avg Price/Gallons
£5.35
|
|
Total Miles Tracked
5,990
|
Total Gallons Fueled
243.49
|
Avg Price/Fuel-up
£23.60
|
|
Total Spent
£1,298.16
|
Avg Price/Mile
£0.22
|
Avg MPG
24.6
|
2013
|
Total Fuel-ups
44
|
Avg Miles/Fuel-Up
142.6
|
Avg Price/Gallons
£5.27
|
|
Total Miles Tracked
6,276
|
Total Gallons Fueled
264.29
|
Avg Price/Fuel-up
£31.72
|
|
Total Spent
£1,395.51
|
Avg Price/Mile
£0.22
|
Avg MPG
23.7
|
2014
|
Total Fuel-ups
47
|
Avg Miles/Fuel-Up
200.6
|
Avg Price/Gallons
£5.01
|
|
Total Miles Tracked
9,426
|
Total Gallons Fueled
408.42
|
Avg Price/Fuel-up
£43.05
|
|
Total Spent
£2,023.13
|
Avg Price/Mile
£0.21
|
Avg MPG
23.1
|
2015
|
Total Fuel-ups
16
|
Avg Miles/Fuel-Up
316.8
|
Avg Price/Gallons
£4.13
|
|
Total Miles Tracked
5,068
|
Total Gallons Fueled
222.49
|
Avg Price/Fuel-up
£57.63
|
|
Total Spent
£922.16
|
Avg Price/Mile
£0.18
|
Avg MPG
22.8
|
2016
|
Total Fuel-ups
25
|
Avg Miles/Fuel-Up
294.1
|
Avg Price/Gallons
£4.18
|
|
Total Miles Tracked
7,353
|
Total Gallons Fueled
313.40
|
Avg Price/Fuel-up
£52.37
|
|
Total Spent
£1,309.34
|
Avg Price/Mile
£0.18
|
Avg MPG
23.5
|
2017
|
Total Fuel-ups
33
|
Avg Miles/Fuel-Up
272.7
|
Avg Price/Gallons
£4.48
|
|
Total Miles Tracked
9,000
|
Total Gallons Fueled
383.46
|
Avg Price/Fuel-up
£52.12
|
|
Total Spent
£1,719.81
|
Avg Price/Mile
£0.19
|
Avg MPG
23.5
|
2018
|
Total Fuel-ups
34
|
Avg Miles/Fuel-Up
247.2
|
Avg Price/Gallons
£4.81
|
|
Total Miles Tracked
7,909
|
Total Gallons Fueled
333.79
|
Avg Price/Fuel-up
£50.04
|
|
Total Spent
£1,701.28
|
Avg Price/Mile
£0.20
|
Avg MPG
23.7
|
2019
|
Total Fuel-ups
33
|
Avg Miles/Fuel-Up
280.4
|
Avg Price/Gallons
£4.86
|
|
Total Miles Tracked
9,254
|
Total Gallons Fueled
377.28
|
Avg Price/Fuel-up
£55.64
|
|
Total Spent
£1,836.07
|
Avg Price/Mile
£0.20
|
Avg MPG
24.5
|
2020
|
Total Fuel-ups
22
|
Avg Miles/Fuel-Up
218.0
|
Avg Price/Gallons
£4.43
|
|
Total Miles Tracked
4,797
|
Total Gallons Fueled
210.55
|
Avg Price/Fuel-up
£42.48
|
|
Total Spent
£934.53
|
Avg Price/Mile
£0.19
|
Avg MPG
22.8
|
2021
|
Total Fuel-ups
33
|
Avg Miles/Fuel-Up
213.7
|
Avg Price/Gallons
£5.12
|
|
Total Miles Tracked
7,052
|
Total Gallons Fueled
285.14
|
Avg Price/Fuel-up
£44.40
|
|
Total Spent
£1,465.22
|
Avg Price/Mile
£0.21
|
Avg MPG
24.7
|
2022
|
Total Fuel-ups
32
|
Avg Miles/Fuel-Up
249.9
|
Avg Price/Gallons
£6.62
|
|
Total Miles Tracked
7,496
|
Total Gallons Fueled
297.65
|
Avg Price/Fuel-up
£68.03
|
|
Total Spent
£2,176.89
|
Avg Price/Mile
£0.26
|
Avg MPG
25.2
|
2023
|
Total Fuel-ups
53
|
Avg Miles/Fuel-Up
290.9
|
Avg Price/Gallons
£5.94
|
|
Total Miles Tracked
15,418
|
Total Gallons Fueled
559.61
|
Avg Price/Fuel-up
£62.90
|
|
Total Spent
£3,333.95
|
Avg Price/Mile
£0.22
|
Avg MPG
27.6
|
2024
|
Total Fuel-ups
41
|
Avg Miles/Fuel-Up
326.5
|
Avg Price/Gallons
£5.48
|
|
Total Miles Tracked
12,732
|
Total Gallons Fueled
450.00
|
Avg Price/Fuel-up
£62.65
|
|
Total Spent
£2,568.81
|
Avg Price/Mile
£0.19
|
Avg MPG
28.3
|
2025
|
Total Fuel-ups
7
|
Avg Miles/Fuel-Up
270.3
|
Avg Price/Gallons
£5.42
|
|
Total Miles Tracked
1,892
|
Total Gallons Fueled
68.10
|
Avg Price/Fuel-up
£52.67
|
|
Total Spent
£368.72
|
Avg Price/Mile
£0.19
|
Avg MPG
27.8
|